/
Pie charts exposure
Pie charts exposure
- Lena Birath
Owned by Lena Birath
Bricknode Broker version 2.08
In this article, we will describe how to add Pie charts to the customer analysis tab, in Admin and Customer Front.
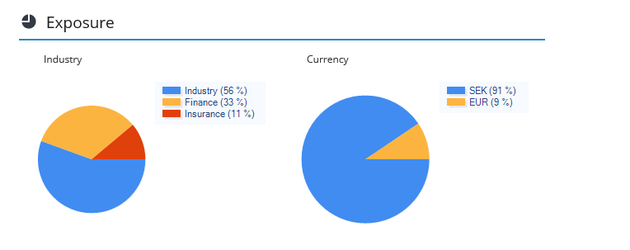
With the pie charts we are able to display holdings by category such as industry information. We can also add pie charts to display the distribution of holdings on the account in different currencies.
When it comes to displaying category holdings, there are three settings that need to be made before the pie charts are displayed.
- Instrument categorization is used to put instrument in different categories to be able to filter these for different purposes like in pie charts or tax reporting.
Navigate to System Data > Category Management in order to create, edit or view instrument categories. This article describes how to add categoriy groups and categories: Instrument Categorization
Example of category groups and categories
Category Group: Industry, Region
Category: Finance, Industry, Insurance, Sweden, US, India
Example category groups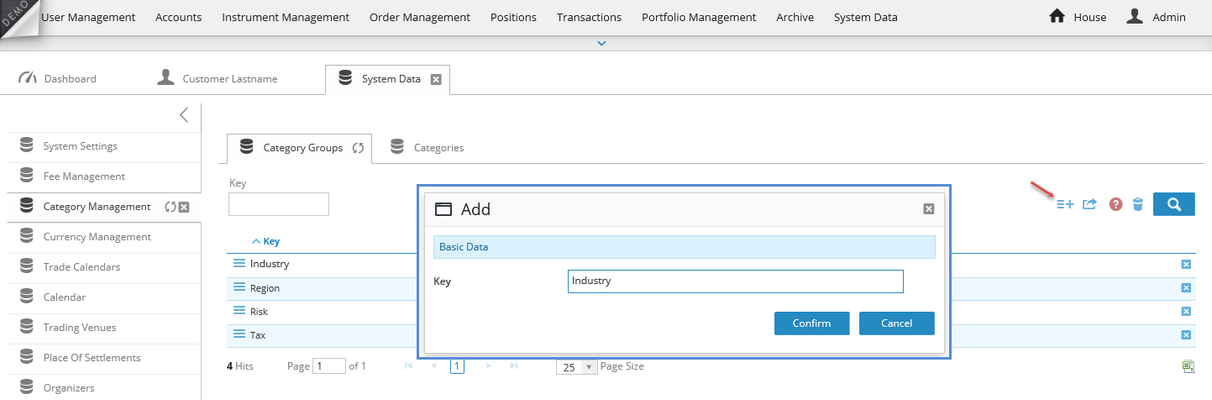
Example categories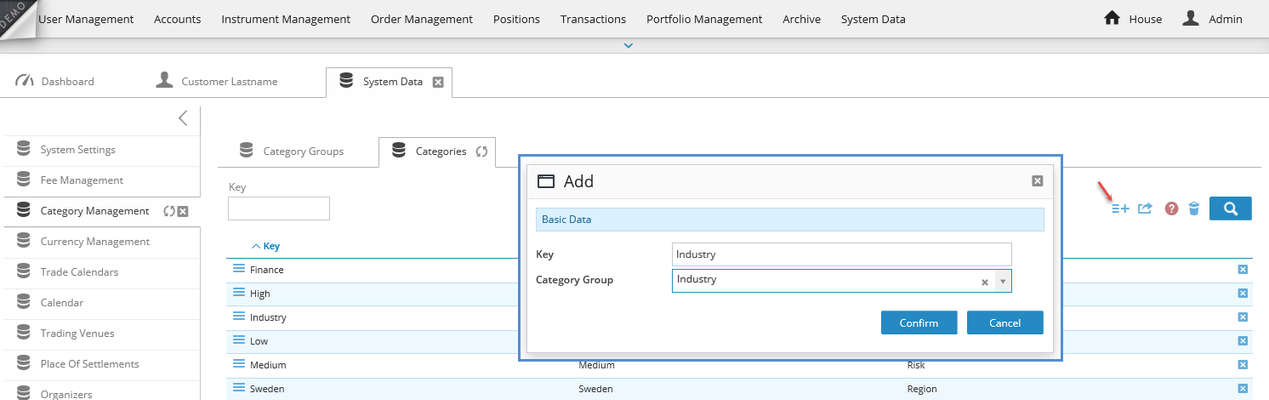
- After adding the category groups and categories the next step is to add categories to the instrument. Navigate to the action menu of the instrument.
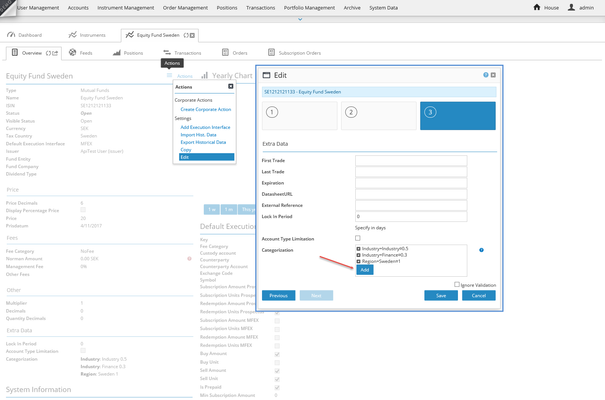
Click Add and a dialog will open where we can select Category Group, Category and Allocation. Click Confirm to Save. If we have added categories already to the Instrument, will the information be displayed in the blue field.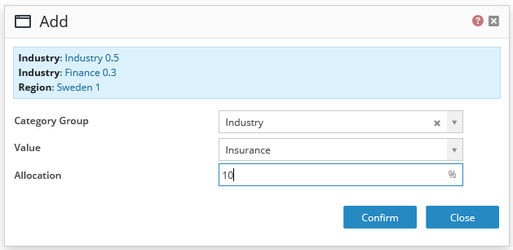
The categories are added to the instrument.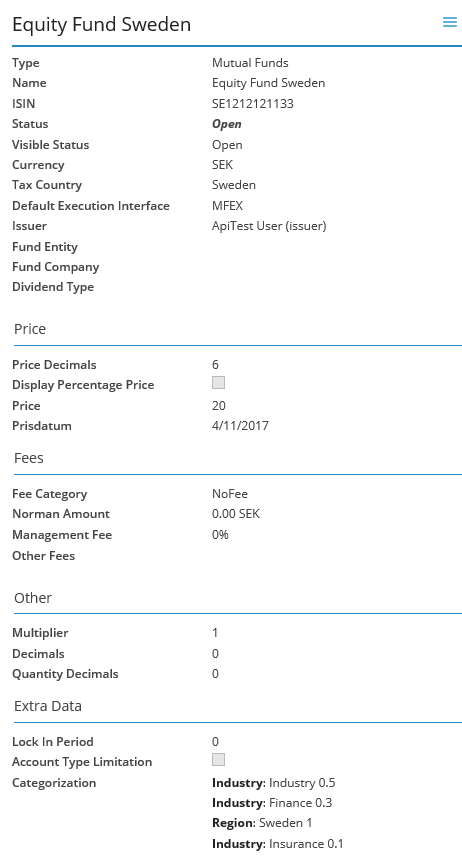
- We can now make pie chart settings. Navigate to the House > House view >Details tab
Click on edit button to add settings.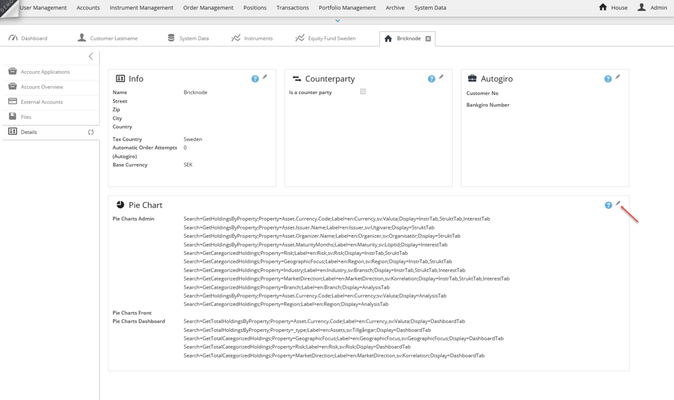
Pie Charts Admin will display pie charts in Bricknode Broker Admin > Account Overview > Analysis Tab
Pie Charts Front will display pie charts in the Customer Front.
Pie Charts Dashboard is obsolete and should not be used.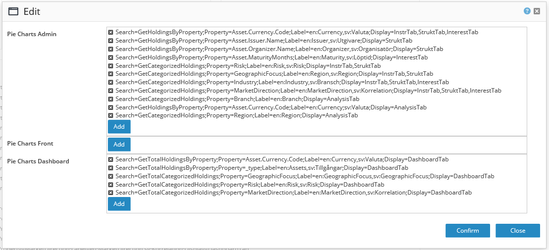
Click Add to choose which pie chart that should be displayed.
There are two types to choose from, category holding (GetCategorizedHoldings) and property holding (GetHoldingsByProperty).
We will first describe the type called GetCategorizedHoldings, next choose category group and location (at present Analysis Tab is the only choice where pie charts is displayed in Bricknode Broker). Click Confirm to Save.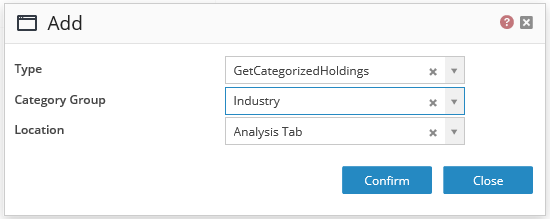
We have now added information so pie charts will be displayed on the customer front for the category group Industry. Click Confirm to Save.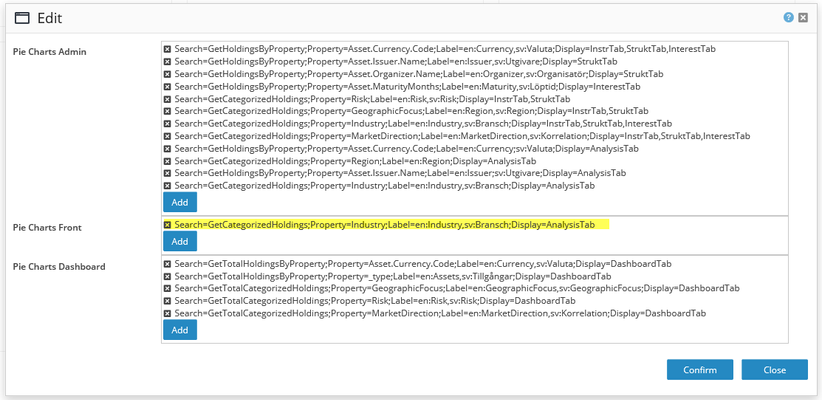
A pie chart is now displayed at the Analysis tab for the customer.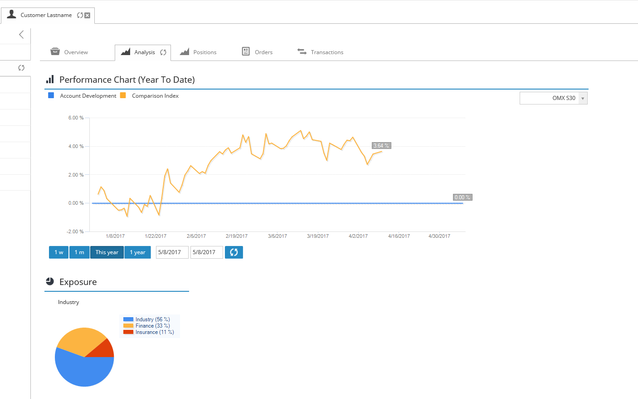
We can also choose to add property holding (GetHoldingsByProperty). For example if we use the property Asset.Currency.Code, the pie chart will display the distribution of holdings on the account in different currencies.
Type: GetHoldingsByProperty
Property: Asset.Currency.Code (Currency), Asset.Issuer.Name (Issuer)
Label: This is the headline of the chart. Following “sv:” the headline in Swedish is written. Following “en:” the headline in English is written. Important is to use ; (semi-colon) between the labels, en:XXX;sv:XXX
Location: where the pie chart should be displayed (at present Analysis Tab is the only place where pie charts is displayed in Bricknode Broker)
Click Confirm to Save.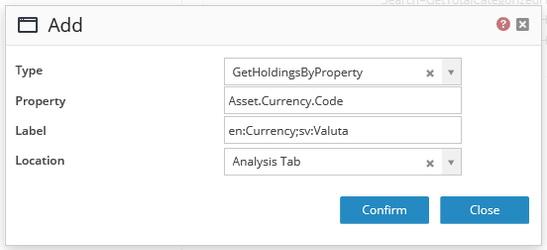
A pie chart is now displayed on the Analysis tab for the customer that displays currency holding.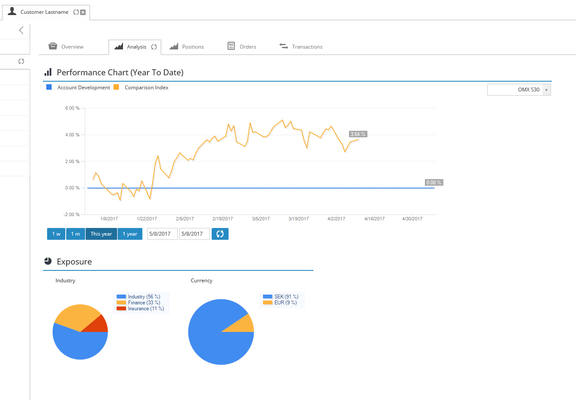
, multiple selections available,
Related content
Release Notes - 2.08
Release Notes - 2.08
More like this
Release Notes - 2.15
Release Notes - 2.15
More like this
Other
Other
More like this
Release Notes - 2.12
Release Notes - 2.12
More like this
Release Notes - 2.16
Release Notes - 2.16
More like this
Instrument Categorization
Instrument Categorization
More like this
© 2009 - 2023 Huddlestock Technologies AB All rights reserved | Huddlestock Terms of use | Support portal